

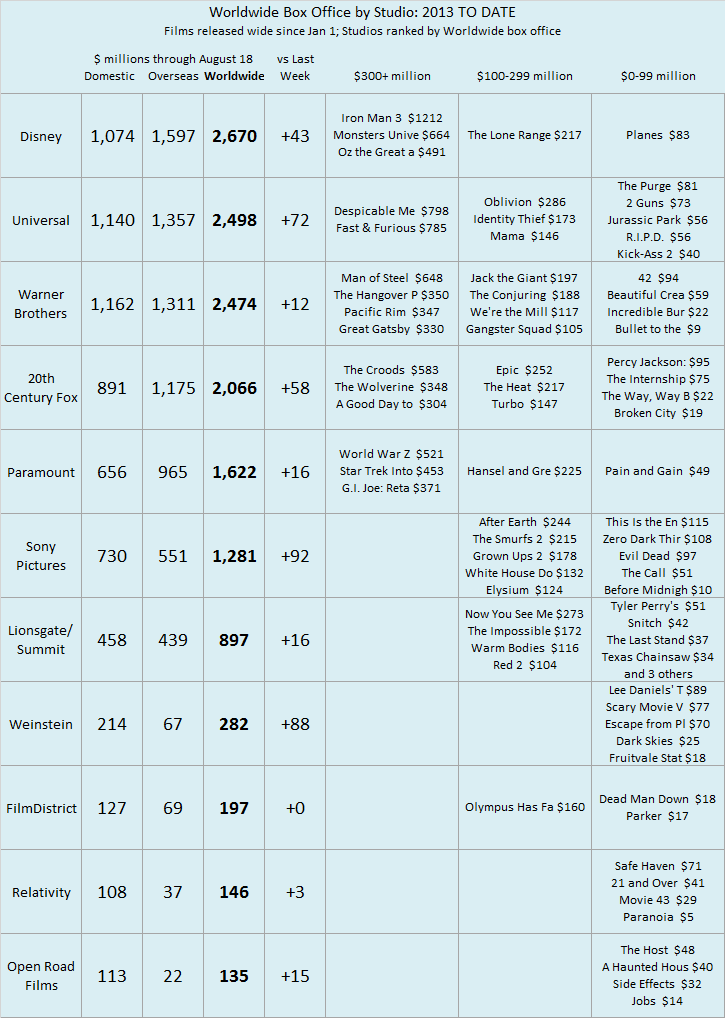
WORLDWIDE STUDIO SCORECARD. Universal and Warner Brothers again flipped positions in the year to date worldwide box office chart. Universal didn’t have much this week (the lame domestic opening of Kick-Ass 2 and some continued overseas business from Despicable Me 2), but it was certainly more than Warner Brothers, which has grown very quiet here and abroad. Sony actually had the best week of the studios (with continued significant overseas revenue from The Smurfs 2, Elysium and Grown Ups 2). But Weinstein was not far behind with the introduction of Lee Daniels’ The Butler, which pushed the small studio ahead of FilmDistrict for the year. However, the worldwide gross for The Butler will not grow much from here as it has limited overseas appeal. The acclaimed film has three international strikes against it: very American subject matter, a very serious drama and a predominantly African-American cast.
Reminder: the chart below has been reformatted and expanded to include a look at all releases from each studio, divided into three buckets: worldwide grosses of over $300 million, grosses between $100 million and $299 million, and films under $100 million worldwide.
TOTAL NORTH AMERICAN BOX OFFICE. Looking at wide-release films in North America (those that play on at least 400 screens at some point), 2013 now totals over $6.7 billion, still 1% ahead of 2012’s pace and still 4% above the prior four-year average 2009-2012. Each year-to-date period below is defined as the first Monday after New Year’s Day through the most recent Sunday. The past week generated an okay $203 million in wide-release North American box office, up 3% from the same week last year but down 5% from the 2009-2012 average for the same week. (The most recent week’s numbers are based on weekend estimates, which are usually at worst a couple of percentage points off from the final weekend tallies.)
| North American Box Office YEAR TO DATE | ||
| (billions) | Weeks 1-32 | |
| 2013 | $6.730 | Jan 7-Aug 18 |
| 2012 | $6.682 | Jan 2-Aug 12 |
| 2010 | $6.511 | Jan 4-Aug 15 |
| 2009 | $6.470 | Jan 5-Aug 16 |
| 2011 | $6.335 | Jan 3-Aug 14 |
Over the past six weeks, 2013 is now 3% behind the same six weeks in 2012 and even with the four-year average in the same time frame.
| North American Box Office LAST SIX WEEKS | ||
| (billions) | Weeks 27-32 | |
| 2011 | $1.631 | July 4-Aug 14 |
| 2012 | $1.553 | July 2-Aug 12 |
| 2013 | $1.508 | July 8-Aug 18 |
| 2010 | $1.462 | July 5-Aug 15 |
| 2009 | $1.372 | July 6-Aug 16 |

