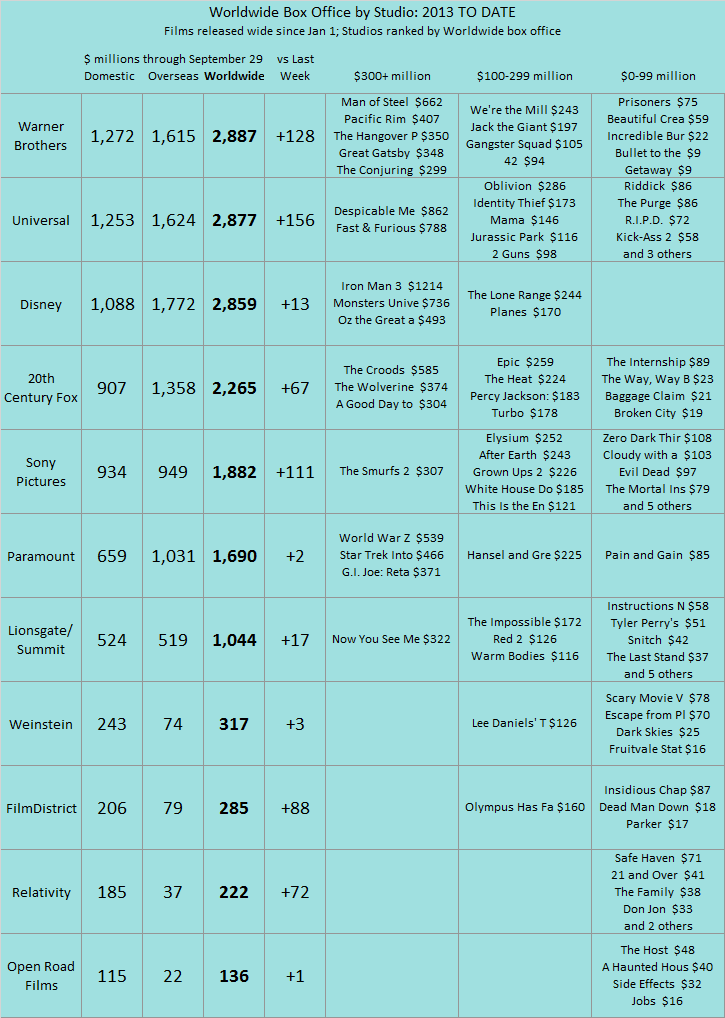
STUDIO SCORECARD. In the worldwide studio rankings for 2013 to date, the weekly changes look much higher than normal. Most of those increases are a function of some September films not being fully counted in the yearly totals for the past few weeks. All of the 2013 films are properly accounted for now.
Warner Brothers now claims the top spot, followed closely by the other studios in the Valley Conference (Universal and Disney). Note all three 818 studios are tightly bunched with just under $2.9 billion each. Warner Brothers has followed its usual strategy of volume — they have the most $300+ million movies, but their top film is “only” $662 million. In contrast, Disney has followed the micro-slate strategy, with half their films over $300 million (and their top film an incredible $1.2 billion) and an amazing zero films in the $0-99 million clunker box.
The studios in the 310 Conference remain closer to $2 billion to date or less. 20th Century Fox has made a reasonable number of films but just hasn’t had enough big hits. Sony has had a high-volume strategy but has really whiffed (only one film in the $300+ million category, but just barely so, and way too many clunkers). Paramount has a slate very similar to Disney’s (few films but nicely distributed across the performance categories). The big difference is Paramount has not had a true mega-hit.
TOTAL NORTH AMERICAN BOX OFFICE. Looking at wide-release films in North America (those that play on at least 400 screens at some point), 2013 now totals $7.5 billion, 1% ahead of 2012’s pace and 3% above the prior four-year average 2009-2012 ($7.327 billion). Each year-to-date period below is defined as the first Monday after New Year’s Day through the most recent Sunday. The past week generated a decent $117 million in wide-release North American box office, down 3% from the 2009-2012 average for the same week ($120 million) but up 9% from the same week last year ($107 million). (The most recent week’s numbers are based on weekend estimates, which are usually at worst a couple of percentage points off from the final weekend tallies.)
| North American Box Office YEAR TO DATE | ||
| (billions) | Weeks 1-38 | |
| 2013 | $7.520 | Jan 7-Sep 29 |
| 2012 | $7.461 | Jan 2-Sep 23 |
| 2011 | $7.178 | Jan 3-Sep 25 |
| 2010 | $7.351 | Jan 4-Sep 26 |
| 2009 | $7.318 | Jan 5-Sep 27 |
Over the past six weeks, 2013 is still 1% above the same six weeks in 2012 but 5% below the four-year average in the same time frame ($0.828 billion).
| North American Box Office LAST SIX WEEKS | ||
| (billions) | Weeks 33-38 | |
| 2013 | $0.789 | Aug 19-Sep 29 |
| 2012 | $0.779 | Aug 13-Sep 23 |
| 2011 | $0.843 | Aug 15-Sep 25 |
| 2010 | $0.840 | Aug 16-Sep 26 |
| 2009 | $0.848 | Aug 17-Sep 27 |