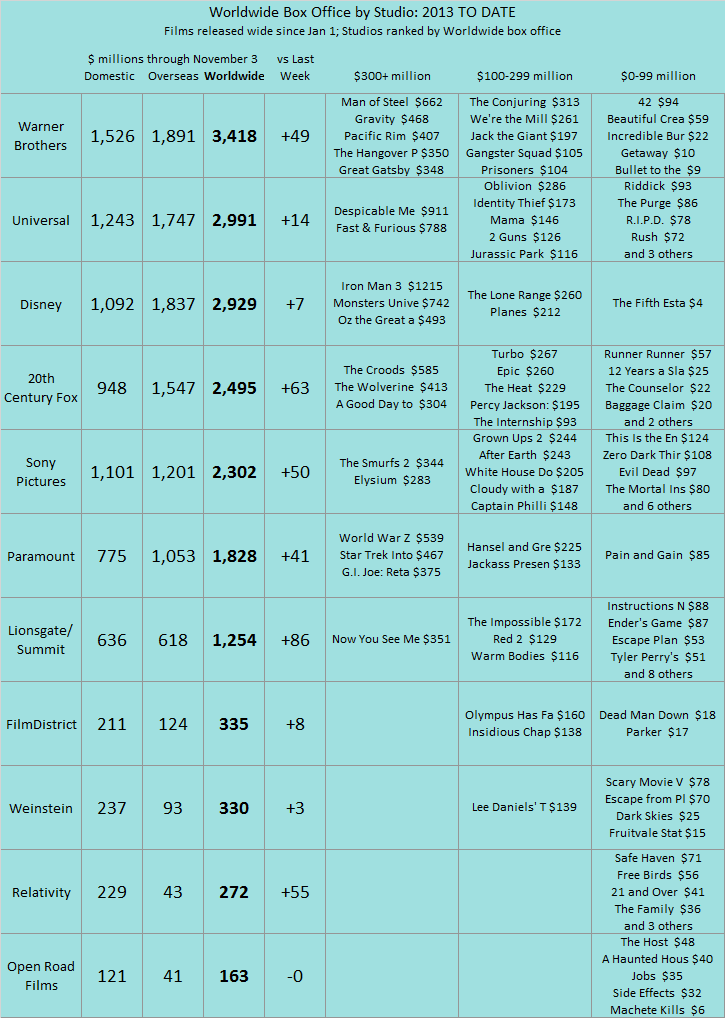
Updated STUDIO SCORECARD:

TOTAL NORTH AMERICAN BOX OFFICE. Looking at wide-release films in North America (those that play on at least 400 screens at some point), 2013 now totals over $8.2 billion, now basically even with last year’s pace and 3% above the prior four-year average 2009-2012 ($8.005 billion). Each year-to-date period below is defined as the first Monday after New Year’s Day through the most recent Sunday. The past week generated a strong $153 million in wide-release North American box office, 28% above the 2009-2012 average for the same week ($121 million) and 26% above the same week last year ($119 million). (The most recent week’s numbers are based on weekend estimates, which are usually at worst a couple of percentage points off from the final weekend tallies.)
| North American Box Office YEAR TO DATE |
|
(billions) |
Weeks 1-43 |
| 2013 |
$8.222 |
Jan 7-Nov 3 |
| 2012 |
$8.205 |
Jan 2-Oct 28 |
| 2011 |
$7.798 |
Jan 3-Oct 30 |
| 2010 |
$8.008 |
Jan 4-Oct 31 |
| 2009 |
$8.008 |
Jan 5-Nov 1 |
Over the past six weeks, 2013 is now 4% below the same six weeks in 2012 but 3% above the four-year average in the same time frame ($0.798 billion).
| North American Box Office LAST SIX WEEKS |
|
(billions) |
Weeks 38-43 |
| 2013 |
$0.819 |
Sep 23-Nov 3 |
| 2012 |
$0.850 |
Sep 17-Oct 28 |
| 2011 |
$0.761 |
Sep 19-Oct 30 |
| 2010 |
$0.778 |
Sep 20-Oct 31 |
| 2009 |
$0.804 |
Sep 21-Nov 1 |
Related Posts
-
Weekend Box Office Predictions
The weekend predictions will return next week, when Exodus: God and Kings and Top Five are released nationally. This weekend, typical for the post-Thanksgiving weekend, is extremely quiet. Only The Pyramid is opening at a very small 589 theaters.
-
-
Year to Date Box Office & Worldwide Studio Scorecard
STUDIO SCORECARD. In the worldwide studio rankings for 2013 to date, very little change from last week. TOTAL NORTH AMERICAN BOX OFFICE. Looking at wide-release films in North America (those that play on at least 400 screens at some point), 2013 now totals just under $8.0 billion, just barely ahead of 2012’s pace and…
-
Year to Date Box Office & Worldwide Studio Scorecard
STUDIO SCORECARD. In the worldwide studio rankings for 2013 to date, only moderate changes for each studio. The biggest gainer this week was Paramount, which released a film from its tiny slate: Jackass Presents: Bad Grandpa. However, it shows just how slow the box office environment is right now when a $93 million…
-
Year to Date Box Office & Worldwide Studio Scorecard
STUDIO SCORECARD. The worldwide studio rankings for 2013 to date remain the same as last week’s. Reminder: the chart below has been reformatted and expanded to include a look at all releases from each studio, divided into three buckets: worldwide grosses of over $300 million, grosses between $100 million and…