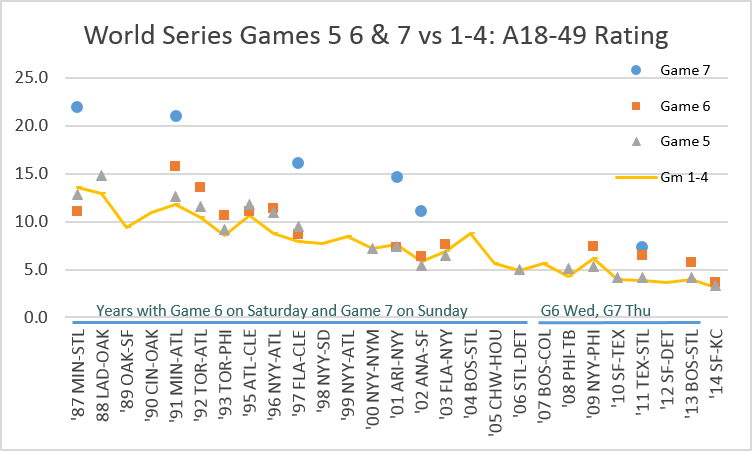
Game 6 of the World Series Tuesday night averaged a 3.0 adult 18-49 fast national rating, which we are estimating will go up to around a 3.5 adult 18-49 rating in the official nationals (after time zone adjustment for this live telecast). Previous record low for Game 6 (a 5.7 in 2013 for Boston-St. Louis, a deciding game).
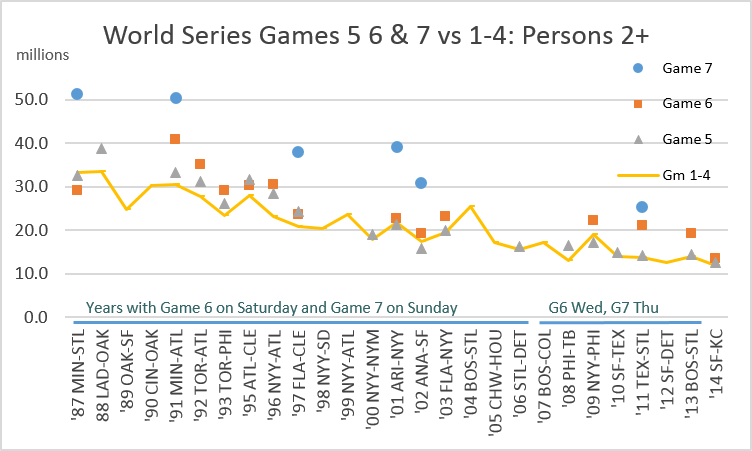
With the broad measure of persons 2+, Game 6 averaged a preliminary 11.3 million persons 2+ in the fast nationals, which we are estimating will rise to 13.4 million people in the official nationals later today (actually 13,372,000 is the official number). Previous low for Game 6: 19,178,000 in 2013 for Boston-St. Louis, which was nearly identical to 19,221,000 in 2002 when the San Francisco Giants failed to close out that series and opened the door to a Game 7, where the Anaheim Angels (long a doormat) won it all at home. History repeating itself on the field with a Royals win tonight? Possibly. One thing we do know is that tonight’s Game 7 will not amass a 50 million person audience that was possible around 1990 or even the 40 million audience around 2000. The last Game 7 (in 2011) hit 25 million. This year 20 million would be a stretch: 18 million is probably more likely.
The tables below tracking the recent six years have also been updated with estimated Game 6 ratings for 2014 (adjusted fast nationals). Official ratings for Game 6 will be posted later today. Game 7 (Wednesday night) will be posted early Thursday afternoon.
| World Series TV Ratings by Game Since 2009 (Live+Same Day) | ||||||||
| A18-49 Rating | G1 | G2 | G3 | G4 | G5 | G6 | G7 | |
| 2009 | NYY-PHI | 6.3 | 5.8 | 4.7 | 7.8 | 5.3 | 7.4 | |
| 2010 | TEX-SF | 4.7 | 4.0 | 2.9 | 4.3 | 4.2 | ||
| 2011 | TEX-STL | 4.2 | 4.0 | 3.2 | 4.2 | 4.2 | 6.5 | 7.4 |
| 2012 | DET-SF | 3.6 | 3.5 | 2.8 | 4.7 | |||
| 2013 | BOS-STL | 4.2 | 3.6 | 3.3 | 4.6 | 4.1 | 5.7 | |
| 2014 | KC-SF | 3.4 | 3.4 | 3.1 | 2.6 | 3.3 | 3.5 | |
| P2+ (millions) | G1 | G2 | G3 | G4 | G5 | G6 | G7 | |
| 2009 | NYY-PHI | 19.51 | 18.90 | 15.40 | 22.76 | 17.09 | 22.34 | |
| 2010 | TEX-SF | 15.01 | 14.13 | 11.46 | 15.54 | 14.95 | ||
| 2011 | TEX-STL | 14.17 | 14.28 | 11.20 | 15.16 | 14.32 | 21.06 | 25.40 |
| 2012 | DET-SF | 12.24 | 12.34 | 10.47 | 15.49 | |||
| 2013 | BOS-STL | 14.40 | 13.43 | 12.47 | 15.98 | 14.45 | 19.18 | |
| 2014 | KC-SF | 12.19 | 12.92 | 12.13 | 10.74 | 12.64 | 13.37 | |