With the 2016 Democratic National Convention kicking off in Philadelphia, we will be covering the daily ratings battle for the television audience starting Tuesday afternoon, just as we did for the RNC in Cleveland. Beyond the number of viewers watching, it is often helpful to take a step back and look more deeply at who is watching. Specifically we examined the total audience for the RNC and DNC telecasts in 2008 and 2012 each night, combining the major networks (three broadcast and three cable) into one collective audience to look for differences between Republican convention viewers and Democratic convention viewers. We used our detailed Audience Map format to examine the small gender-age segments, as well as many other characteristics such as income, education, geography and ethnicity. (The detailed ratings such as income and education for the 2016 RNC will not be available for weeks, and we decided to combine the last two cycles since 2012 was a relatively down year in terms of audience, as well as an odd 3-day format shortened by severe weather).
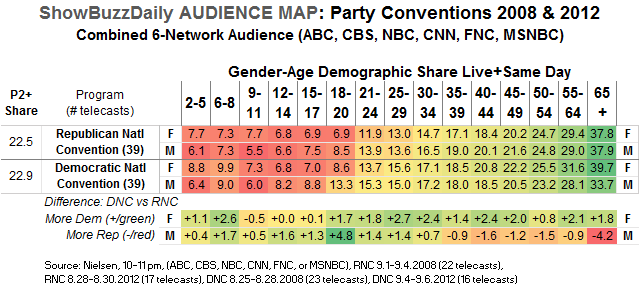
In sum, RNC and DNC viewers are more similar than they are different, but the occasional differences are interesting and logical. Below is our standard Audience Map with the 30 discrete gender-age segments, ranging from a low of a 5.5 share for boys 9-11 watching the RNC the past two cycles (meaning a little less than one share point for each of of the six news networks) to a high of a 39.7 share for women 65+ watching the DNC (meaning well over an average 6 share for each network). For each party convention, viewership is fairly insignificant for kids, teens and adults under the drinking age. But starting at age 21, viewership rises steadily through each stage of adulthood, just as voter turnout generally rises. At the bottom of the chart, the difference between the DNC and RNC audience is displayed, with more Democratic segments appearing as green positive numbers, while more Republican segments are negative numbers shaded in red/orange. The gender gap is alive and well with men over 35, who have slightly higher viewership levels for the RNC than DNC (although men over 65, the bullseye of Fox News, boasts a sizable 4 share-point margin for the RNC). In contrast, female viewers favor the DNC over the RNC with approximately 2 share-point advantages in virtually every adult category. Finally, males under 35 slightly favor the DNC over the RNC with a small but consistent 1 share-point advantage (highlighted by a nearly 5 point margin with men 18-20). But the big takeaway is that, like TV news viewing in general, viewership of the national political conventions is an older person’s fancy.
While the audience for the RNC and DNC is quite old, it is also fairly upscale for both parties, peaking with viewers in homes with incomes over $60K and especially $100K and peaking in households headed by someone with a 4-year college degree or more. The DNC audience does tilt relatively a little more toward household incomes under $50K and simultaneously toward better educated viewers, while RNC viewership is relatively stronger with some upper income homes and those headed by a high school graduate. But these differences are fairly minor. Again, the profiles of DNC and RNC audiences are more similar than dissimilar in the socioeconomic categories.

In terms of geography, the DNC audience tilts slightly toward “A” counties (the largest, most urbanized counties in the country) and significantly toward the East Central region (think the Industrial Midwest) and moderately toward the Southeast and West Central (the agricultural Midwest). The RNC tilts significantly toward the Southwest, but quite surprisingly not toward the “C&D” Counties (the more rural and smaller counties that often light up in a voting map, covering large areas in the center of the country). Again, the geography of the DNC and RNC audience is actually surprisingly similar, given standard geographic voting trends.
Not surprisingly, one of the biggest advantages for DNC coverage comes with African-American/ Black viewers, traditionally one of the most reliable voting blocs for the Democratic coalition. But note the nevertheless substantial rating for the RNC with African-Americans, who remain some of the most enthusiastic and loyal consumers of television across all dayparts and genres. Other ethnic groups and demographic characteristics in the chart below return to the familiar pattern of being fairly close between the two conventions.

Later in the summer we will update this with the ratings from the 2016 conventions in Cleveland and Philadelphia to see if Trump and Clinton changed the audiences from the Obama/McCain/Romney years. But the safe money is on more similarity: despite any ideological differences, the TV audience for national political conventions are fairly standard.
###