

Articles
Full Story »
Year to Date Box Office & Worldwide Studio Scorecard 3.22.2020 — On Hiatus
Posted March 22, 2020 by Mitch Metcalf
The weekly Year to Date Box Office Report & Worldwide Studio Scorecard will return when North American theaters reopen and studios resume wide releases. Coverage of broadcast and cable television ratings will continue as normal. ###
Articles
Full Story »
Year to Date Box Office & Worldwide Studio Scorecard 3.15.2020
Posted March 15, 2020 by Mitch Metcalf
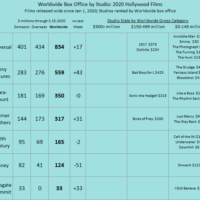
WORLDWIDE STUDIO SCORECARD. Here is an updated look at the 2020 film slates by studios (films entering wide release in the 2020 calendar year). BOX OFFICE. Looking at North American box office, 2020 is now -9% below last year’s comparable span (another 7 points worse than last week) and -21% below this point averaged over […]
Articles
Full Story »
Year to Date Box Office & Worldwide Studio Scorecard 3.8.2020
Posted March 8, 2020 by Mitch Metcalf
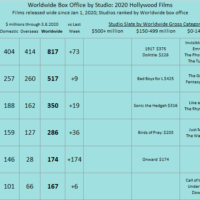
WORLDWIDE STUDIO SCORECARD. Here is an updated look at the 2020 film slates by studios (films entering wide release in the 2020 calendar year). BOX OFFICE. Looking at North American box office, 2020 is now -2% below last year’s comparable span (7 points worse than last week) and -17% below this point averaged over the […]
Articles
Full Story »
Year to Date Box Office & Worldwide Studio Scorecard 3.1.2020
Posted March 1, 2020 by Mitch Metcalf
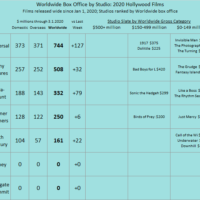
WORLDWIDE STUDIO SCORECARD. Here is an updated look at the 2020 film slates by studios (films entering wide release in the 2020 calendar year). BOX OFFICE. Looking at North American box office, 2020 is now +5% above last year’s comparable span but -15% below this point averaged over the past four years ($1.497 billion). Over […]
Articles
Full Story »
Year to Date Box Office & Worldwide Studio Scorecard 2.23.2020
Posted February 23, 2020 by Mitch Metcalf
WORLDWIDE STUDIO SCORECARD. Here is an updated look at the 2020 film slates by studios (films entering wide release in the 2020 calendar year). BOX OFFICE. Looking at North American box office, 2020 is now +9% above last year’s comparable span but -13% below this point averaged over the past four years ($1.337 billion). Over […]
Articles
Full Story »
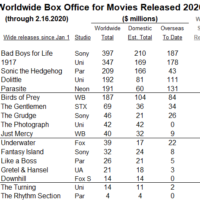
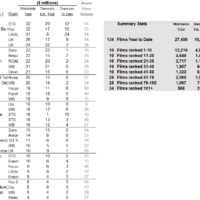
Year to Date Box Office & Worldwide Studio Scorecard 2.16.2020
Posted February 16, 2020 by Mitch Metcalf
WORLDWIDE STUDIO SCORECARD. Here is a first look at the 2020 film slates by studios (films entering wide release in the 2020 calendar year). BOX OFFICE. Looking at North American box office, 2020 is now +14% above last year’s comparable span but -7% below this point averaged over the past four years ($1.110 billion). Over […]
Articles
Full Story »
Year to Date Box Office & Worldwide Studio Scorecard 2.9.2020
Posted February 9, 2020 by Mitch Metcalf
WORLDWIDE STUDIO SCORECARD. Here is a final look at the 2019 film slates by studios (films entering wide release in the 2019 calendar year), including worldwide box office for those films during 2020. We will begin the track of the 2020 slate next week. BOX OFFICE. Looking at North American box office, 2020 is now […]

Articles
Full Story »
Year to Date Box Office & Worldwide Studio Scorecard 2.2.2020
Posted February 2, 2020 by Mitch Metcalf
WORLDWIDE STUDIO SCORECARD. Here is an updated look at the 2019 film slates by studios (films entering wide release in the 2019 calendar year), including worldwide box office for those films during 2020. We will begin the track of the 2020 slate soon. BOX OFFICE. Looking at North American box office, 2020 is now +18% […]