

We spend a lot of time talking about demographics such as adults 18-49 or women 18-34, but those groups are still fairly broad abstractions of the television audience, which of course is made up of individual people. Although we can’t yet talk about individual viewing behavior, we can in fact look at the audience with a more precise level detail by focusing on four- or five-year intervals of gender-age groups in the Nielsen sample. The charts below, the ShowBuzzDaily Audience Maps, look at viewing levels for various programs within 30 distinct gender-age groups.
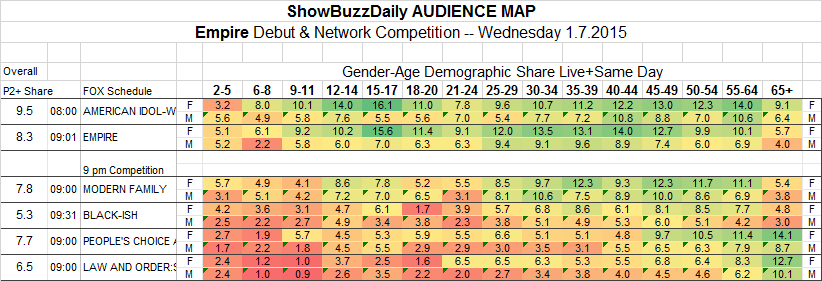
WEDNESDAY JANUARY 7: A GREAT NIGHT FOR FOX. The Audience Map for Wednesday shows just how widespread the initial audience was for the debut of Empire on FOX at 9 pm. A lot of green in a very wide spectrum of ages (above average audience shares compared to the other network programs on the night), all the way from older kids to older adults, although both American Idol and Empire drop off dramatically with 65+ viewers (which is absolutely fine with the FOX ad sales department). And while both FOX programs do better with women than men, Empire closes that gap particularly with the 25-39 age groups (again very welcome news for the network).
The bottom half of the Map below shows the network competition in the 9 pm hour and it clearly illustrates just how old the network audiences usually are. Modern Family does reasonably well starting at the age of 25 but it really doesn’t surge until about age 35. CBS (People’s Choice Awards) and NBC (SVU) are a network’s and ad agencies worst nightmare, with a 55+ or 65+ core audience.
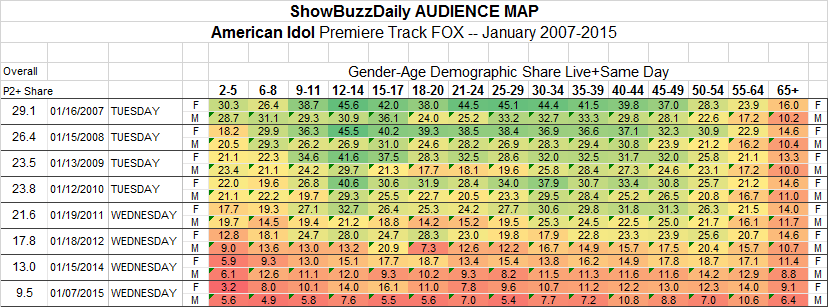
The Sad, Inexorable Decline of American Idol. Of course, everything is relative. As encouraging as the Empire number was for FOX, the continued descent of American Idol is staggering. The chart below tracks the first-night season premieres of American Idol (since 2007), with the various years compared against each other. It really is amazing to look back and remember just how huge American Idol was: 40+ shares with females in each 12-44 group in 2007 and around a 30 share in each 12-49 group. And just like we saw in the 2015 pattern above, an aversion to the show by the oldest groups. One could not create a more perfectly desirable pattern for advertisers.
Younger teens 12-14 stayed intensely loyal to Idol through 2010, but it was the college age young adults (18-24) that really were the canaries in the coal mine, starting their defection in 2009. And it was really 2012 when the defections accelerated to pretty much every group. Today every group is in the red (because 2015 is compared to the glory days), but remember the 2015 numbers don’t look so bad when compared to other 2015 shows on other networks (the chart above) or for that matter compared to other shows on FOX. A double-digit share in any group looks shabby in comparison to past Idol performance, but those same 2015 premiere numbers look somewhat acceptable today.
We will use these Maps from time to time to look at particularly competitive nights or to compare cable networks to one another.
Note: we are looking at audience Share of available audience (people watching television at a particular time) because gender-age Ratings would have been highly misleading. Older viewers watch much more TV than younger viewers, and the Map would be consistently skewed toward the right if we charted Ratings (viewing levels in the total demographic, whether they are watching television or not).

